
An event report shows 150 connections. Registration lists 100 people. It is tempting to announce that language support reached 150 percent of the audience. The calculation is easy; the interpretation is wrong because the two numbers count different things.
Useful reporting starts with the unit, scope, and counting rule. It then separates activity from an outcome such as following an instruction or participating in a discussion. InterScribe's documented reports can show how channels were used. They do not read minds, diagnose access needs, or establish learning.
Open the report and record its scope
On the session page, open Analytics using a role permitted to read it. For a portal-wide view, open Portals, choose the portal, and select Audience, then choose a Period. Record the event or portal, dates, timezone used in your analysis, and the time you captured the figures.
Use How we count beside a figure for its exact rule. The analytics guide is the product reference; the on-screen definition should travel with any number copied into a presentation. If you cannot establish the denominator for a percentage, report the available count and its limitation instead.
Do not combine a session report, a portal period, and an external registration file as though they describe the same population. First check dates, included sessions, access routes, and deduplication.
Know what the documented fields establish
| Field or chart | Documented meaning | What it does not establish |
|---|---|---|
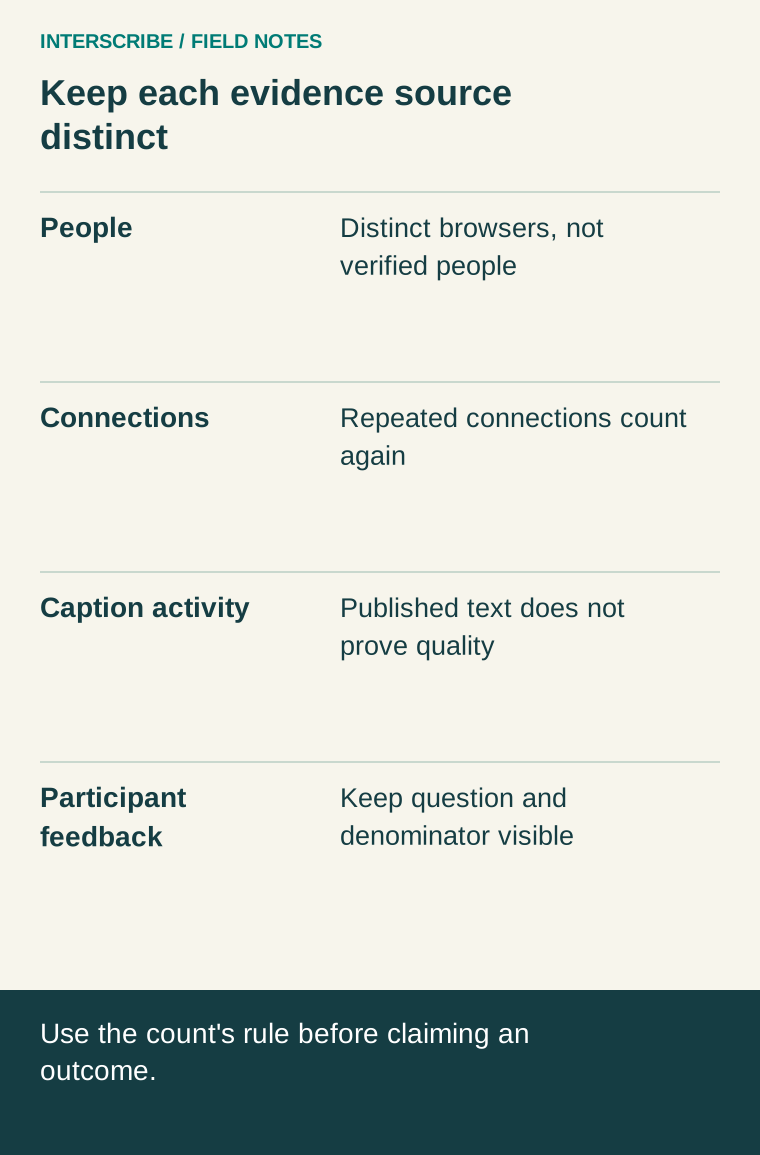
| People | Distinct browsers that opened a channel; reconnecting does not count the same browser again | Verified individual identities or total physical attendance |
| Connections | Every connection, including repeated connections | A count of different people |
| Listening | People on each channel across the session | Attention, comprehension, or a completed learning task |
| Arrivals | When people first opened a channel | Why they arrived then |
| Captions | What each channel published minute by minute | Caption correctness; a quiet interval's cause |
| Languages published | Languages that actually produced captions | Languages merely planned or every language someone needed |
One person may use more than one browser, while several people may read a shared display. Do not silently relabel browser counts “unique attendees.” Also do not assume counts on multiple channels form mutually exclusive groups; inspect the relevant rule before summing or computing a share.
The How people listened breakdown distinguishes Room audio—which can include the floor, a human interpreter, or an AI voice—from Browser voice, and Captions only. “Room audio” is therefore not automatically “people seated in the venue,” and browser voice is not the AI voice service.
Work through a fictional report
The following invented figures illustrate interpretation, not a customer result or a replica of a product screen:
| Source | Fictional figure | Safe statement | Unsupported leap |
|---|---|---|---|
| One session's People figure | 120 distinct browsers | The reported scope counted 120 browsers | 120 different people understood the talk |
| Same scope's Connections figure | 150 connections | Connections exceeded distinct browsers | 30 new attendees joined late |
| Languages published | 3 | Three languages produced captions | Every requested language was served |
| Separate voluntary survey | 18 responses from 30 invitations | 18 ÷ 30 = 60% response among those invited | 60% of all listeners were satisfied |
| Survey task question | 12 of 18 respondents reported finding the next step | 12 ÷ 18 ≈ 66.7% of respondents | Two-thirds of all attendees learned the material |
The connection-to-browser ratio is 150 ÷ 120 = 1.25 for this invented scope. It can prompt an investigation, but it is not an interruption rate. Multiple connections may have several causes; the report alone does not identify them.
The survey results have their own denominator. People who responded may differ from people who did not, and the invited sample may exclude others. Keep the numerator, denominator, question wording, and missing responses together.
Turn a chart pattern into a question
Suppose a caption chart goes quiet while listening activity continues. Inspect the event record: was there a planned break, music, a source problem, or another interruption? A gap is an observation to explain, not automatic evidence of poor recognition.
If arrivals cluster after the start, examine the invitation and joining procedure. Test whether a first-time attendee can find the correct event. The portal page may suggest opening channels early, but a late-arrival pattern alone does not prove confusing instructions caused it.
If a language has little recorded use, check whether it was advertised, discoverable, functioning, and appropriate to the intended participants. Consult outstanding requests before removing it. Low usage cannot erase an agreed access arrangement, and absence of a language in a report cannot reveal people who never reached the service.
Keep time comparisons honest
The portal audience view reports listening time and typical stay. Its documented rule caps each connection's counted listening time at its own event length. That is a connection-based limit, not proof that the person continuously attended or paid attention.
Before comparing events, record their lengths, breaks, formats, access conditions, and audience. A short briefing and a long workshop are not equivalent retention tests. Avoid attributing a change to captions when the speaker, invitation, schedule, and audience also changed.
Use the report to locate a question worth investigating. Use appropriate feedback or a task assessment to answer a question about participant experience. For learning outcomes, the relevant teaching owner should choose the assessment; a browser-duration chart is not a substitute.
Copy this decision record into the debrief
- Observation: Exact figure or chart interval, with source and scope.
- Counting rule: Unit, numerator, denominator if any, and deduplication rule.
- Possible explanations: Include operational and non-problem explanations.
- Additional evidence: Rehearsal record, incident timestamp, invitation check, or voluntary feedback.
- Action: One change that addresses the supported explanation.
- Owner and check: Who will make the change and how the next event will test it.
- Limitation: What the evidence still cannot establish.
For example: “Several arrivals occurred after the introduction. We will test the invitation route with first-time participants before changing the opening schedule.” That is more useful than declaring attendees disengaged.
Ask a voluntary feedback question about a concrete task: “Could you follow the explanation and ask your question before the topic closed?” Include a place to describe a barrier, record the respondent count, and bring the answers to the debrief. Assign each supported improvement an owner and a next-event check using the decision record above. Keep reports aggregated, use appropriate access controls for supporting records, and avoid inferring nationality, disability, or ability from a selected language. A defensible report makes its uncertainty visible while still supporting a concrete next action.